
FxPro Raw+ Live Spreads — Measured, Not Advertised [Pakistan]
Real spreads we recorded on FxPro’s own MetaTrader 5 Raw+ feed — 6 instruments, 3,714,831 ticks sampled, last captured 2026-09-15. The spread you actually trade on, not a marketing ‘from 0.0’.
Open FxPro Account →These spreads were recorded tick by tick on FxPro's own MetaTrader 5 Raw+ feed, and they are quoted per unit — the median is the same number whether the ticket is 0.1 lots or fifty. What size changes is the cash behind each column, and how much the busy-market column matters. Where an instrument shows the same figure in its median and busy-market columns, a large ticket carries no extra spread risk from timing; where the busy-market reading is a multiple of the median, the same lot count can cost several times as much depending on which moment the order lands in. A median describes a sample; the price a large ticket receives is the quote of the instant it arrives.
This is the live, hour-by-hour measured spread feed (refreshed daily). For the Standard vs Raw+ cost comparison and fees, see our spreads & costs page.
Measured Raw+ spreads (pips)
| Instrument | Best (min) | Typical (median) | Busy market (p90) | At capture | Ticks sampled |
|---|---|---|---|---|---|
| EUR/USD | 0.1 | 0.2 | 0.2 | 0.2 | 457,098 |
| GBP/USD | 0.6 | 0.6 | 0.6 | 0.6 | 590,492 |
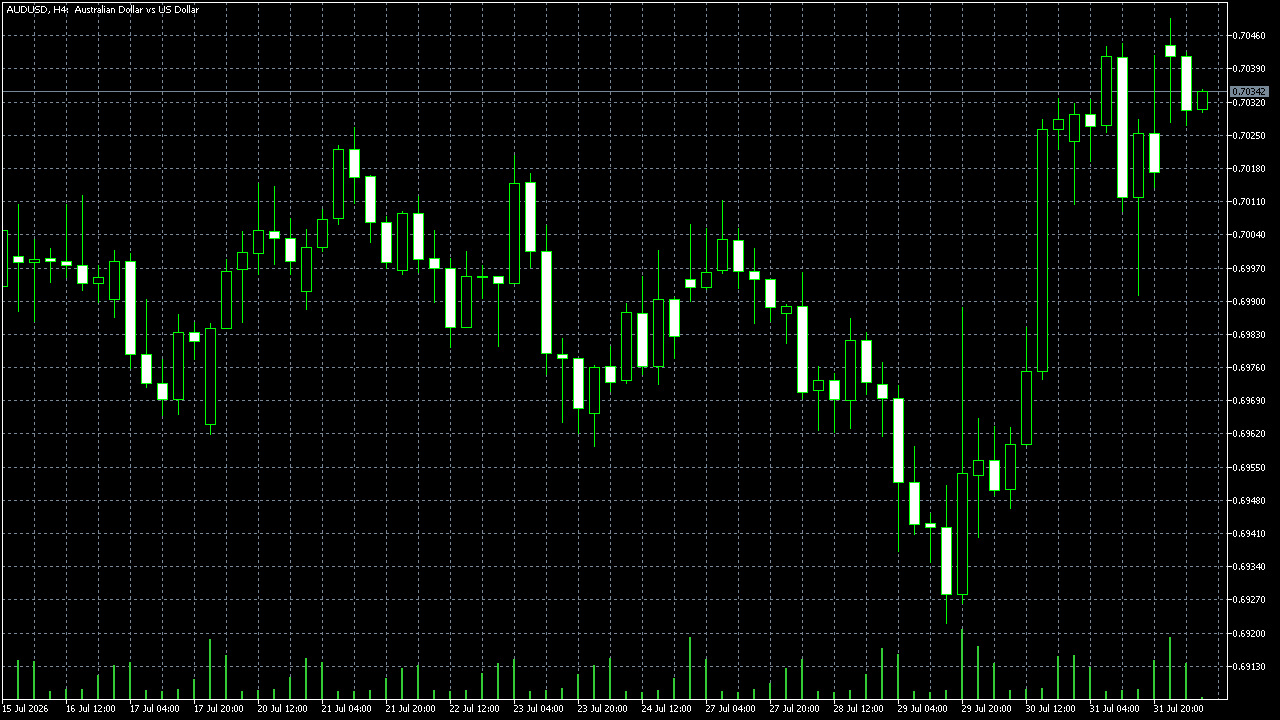
| AUD/USD | 0.2 | 0.4 | 0.8 | 0.4 | 511,715 |
| USD/CAD | 0.1 | 0.4 | 0.5 | 0.4 | 465,429 |
| USD/JPY | 0.3 | 0.3 | 0.5 | 0.3 | 717,421 |
| XAU/USD (Gold) | 15 | 15 | 19 | 15 | 972,676 |
Best = the tightest quiet-market quote we saw; Typical = the median you usually trade; Busy market = the wider spread to expect about 10% of the time (news, rollover, thin liquidity). ‘At capture’ is the live spread at the last reading. Metals such as XAU/USD use a different contract size, so their cash cost is on our gold page. Server FxPro-MT5 Demo, feed 2026.09.15 14:10:41.
Spread through the trading day (measured, last 24h)
| Instrument | Tightest (avg) | Widest (avg) | Worst spike | Through the day |
|---|---|---|---|---|
| EUR/USD | 0.2 (03:00) | 1.782 (00:00) | 9.5 (00:00) | |
| GBP/USD | 0.6 (03:00) | 3.627 (00:00) | 15 (23:00) | |
| AUD/USD | 0.292 (14:00) | 3.98 (00:00) | 25 (23:00) | |
| USD/CAD | 0.292 (09:00) | 2.318 (00:00) | 13.6 (23:00) | |
| USD/JPY | 0.3 (09:00) | 7.082 (00:00) | 16 (23:00) | |
| XAU/USD (Gold) | 15 (09:00) | 75.421 (00:00) | 175 (00:00) |
Table hours are FxPro server time (about UTC+3 / EET); the highlighted guidance above is shown in PKT. Average pip spread by hour over the last 24 hours, with the worst single-tick spike. Spreads run tightest in the peak London–New York overlap and widen around the 00:00 server rollover and the thinner Asian hours — the sparkline is each instrument’s daily shape.
What it costs you per lot (Raw+)
| Instrument | Typical spread | Spread cost / lot | Commission (round turn) | All-in / lot | All-in (pips) |
|---|---|---|---|---|---|
| EUR/USD | 0.2 pips | $2.00 | $7.00 | $9.00 | 0.9 pips |
| GBP/USD | 0.6 pips | $6.00 | $7.00 | $13.00 | 1.3 pips |
| AUD/USD | 0.4 pips | $4.00 | $7.00 | $11.00 | 1.1 pips |
| USD/CAD | 0.4 pips | $2.87 | $7.00 | $9.87 | 1.37 pips |
| USD/JPY | 0.3 pips | $1.94 | $7.00 | $8.94 | 1.38 pips |
| XAU/USD (Gold) | 15 pips | $15.00 | $7.00 | $22.00 | 22 pips |
All-in round-turn cost for one standard lot (100,000 units): typical spread × pip value, plus the $7 Raw+ commission ($3.50 per lot per side ($7.00 round turn) on Raw+ and cTrader accounts). On a Standard account you pay a wider spread instead of that commission — see the full spreads and costs page.
Open FxPro Account →Advertised ‘from 0.0’ vs what we measured
FxPro markets Raw+ as spreads ‘from 0.0 pips’ — a best-case floor. Across our sample the tightest EUR/USD quote we recorded was 0.1 pips and the typical was 0.2 pips. That is normal: the ‘from’ figure is a floor you rarely trade on, so judge a Raw+ account by its typical spread and how far it widens under load (the p90 column), not the headline number.
How we measured this
- Recorded on FxPro's own MetaTrader 5 Raw+ account — the broker's real pricing feed, not a third-party estimate.
- Captured in-terminal by an MQL5 expert advisor that logs every tick's bid and ask, so the spread is exactly what the platform shows.
- 3,714,831 ticks across 6 instruments; the figures refresh on a schedule.
- Demo and live Raw+ share the same pricing feed, so these spreads are representative of a funded account.
Spreads are variable and widen around high-impact news and the daily rollover. Past readings do not guarantee future spreads. Last updated 2026-09-15.
Reading these columns with a large ticket in mind
The tables above are quoted in pips because pips are the unit that stays still. Your lot count is the unit that moves, and it multiplies every column at once. The median column answers what the ordinary cost of a size looks like; the busy-market column answers what the same size costs when liquidity thins; the at-capture column is one instant, useful mostly as a sanity check against the other two.
Where the median and the busy-market figures are the same number, size carries no extra risk from the spread itself. Where they diverge — and on the metal row they diverge most — the gap is the part of the cost a large ticket cannot control, because it depends on when the order arrives rather than on how it is written. Comparing those two columns instrument by instrument is the fastest way to see which of them tolerate being scaled up at any hour and which want a quiet one.
The number that scales and the number that does not
Two figures on this page behave in opposite ways. Spread cost scales with the lot count without limit: whatever an instrument costs per standard lot, ten lots cost ten times that and fifty cost fifty times, and the commission scales the same way at $3.50 per lot per side. Nothing in either line rewards volume, which is what makes the per-lot table a complete price list for any size.
The fill price does not scale at all — it is one number per ticket, and a large order either receives it or receives an average built from several. That is why cost per lot and cost per million are the honest headlines for size, while the fill is a separate question, answered by the size-by-size table on our trading conditions page rather than here.
One ticket buys a point, a sequence buys the distribution
A single order takes whatever the feed is showing at the instant it arrives, so for that trade the table above is a probability statement rather than a price: the median says where the quote usually sits, the busy-market column says how far it travels when it does. A position assembled out of several tickets is a different animal — it collects a sample of those instants, and its effective cost lands somewhere inside the spread between the columns rather than on any one of them.
That is a reason to read the two columns as a pair whenever the intended size is larger than usual. If an instrument holds the same figure in both, the assembled position costs the same as the single ticket would have, and the schedule of entries can be decided on other grounds. If the columns are far apart, the schedule itself becomes a cost decision, because each additional ticket is another draw from the wider of the two readings.
Turning a pip figure into cash by ticket size (EUR/USD)
| Ticket size | Half a pip of spread | One pip | Two pips |
|---|---|---|---|
| 1 lot | $5 | $10 | $20 |
| 5 lots | $25 | $50 | $100 |
| 10 lots | $50 | $100 | $200 |
| 25 lots | $125 | $250 | $500 |
On a USD-quoted major one pip is worth about $10 per standard lot, so any pip figure in the tables above converts to cash by reading across the row for your size. Read the median column for the ordinary case and the busy-market column for what the same ticket costs when the feed widens; on some instruments the two are the same number, on others the busy-market reading is a multiple of the median. The $3.50-per-lot-per-side commission is charged on top of either.